Data Is Beautiful (42 Photos)
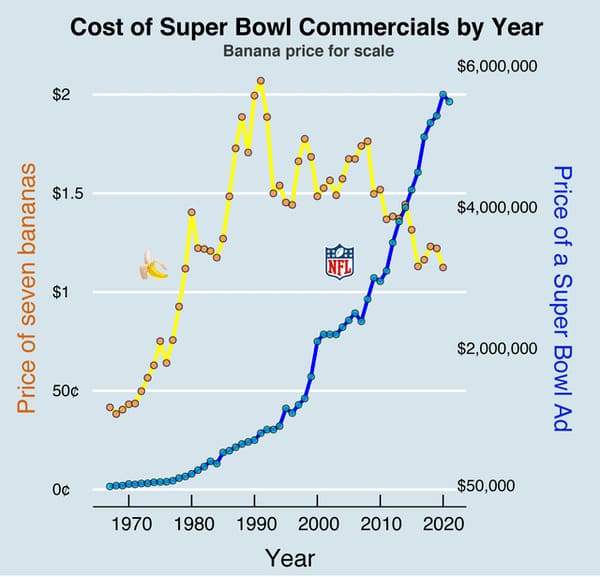
31. Dollars spent on Super Bowl ads.
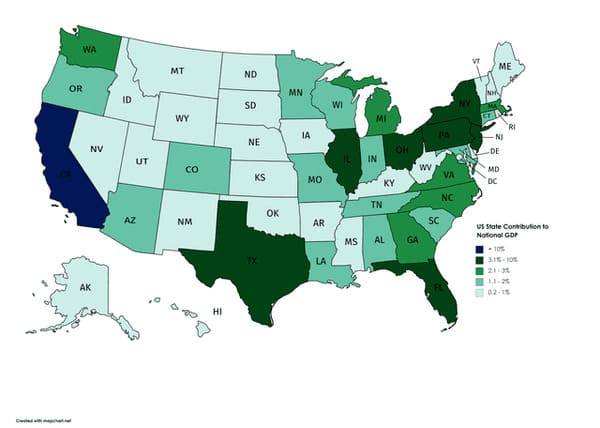
32. Contributions to the GDP by state.
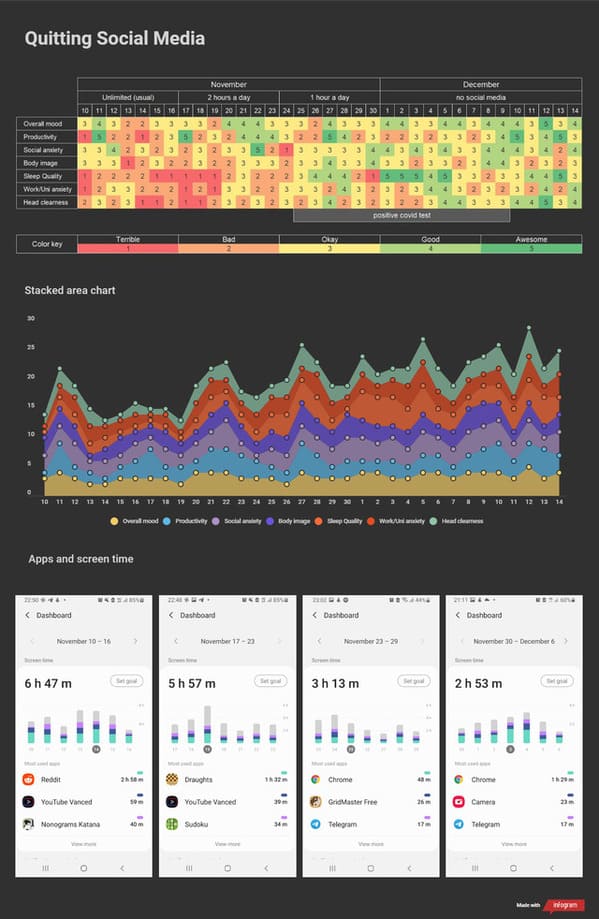
33. Productivity versus social media time graphs.
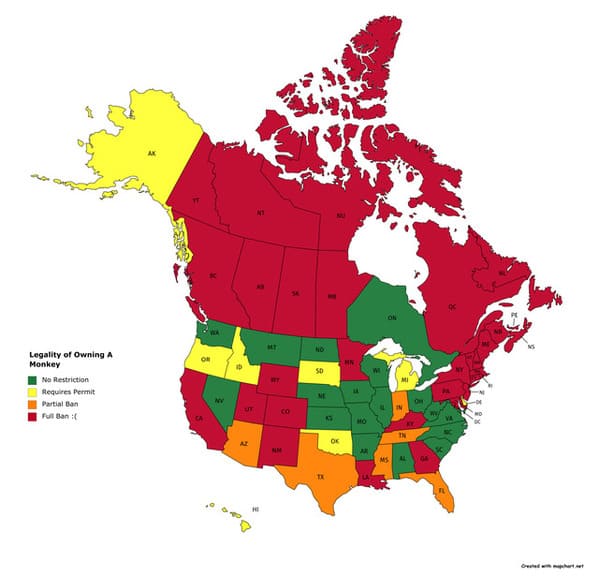
34. Legality of owning a monkey.
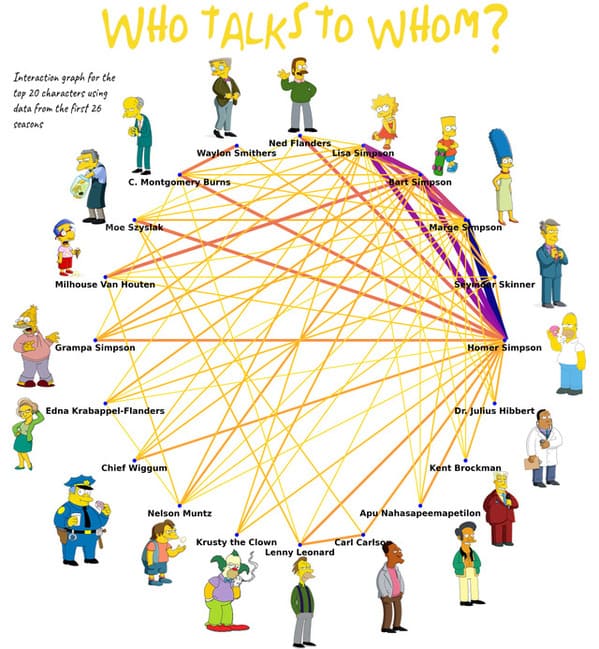
35. The Simpsons talking chart.
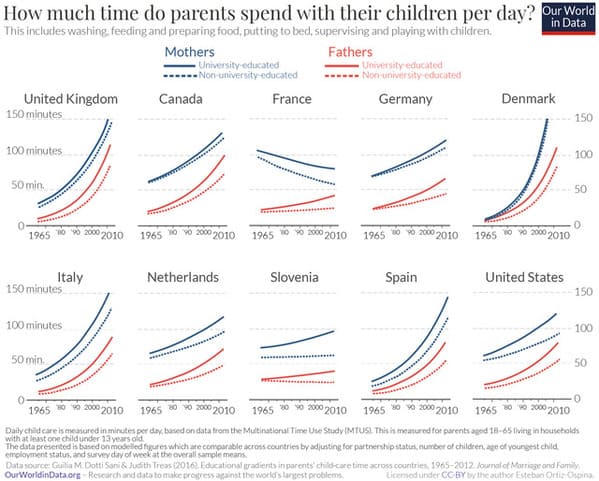
36. Time spent with children by country.
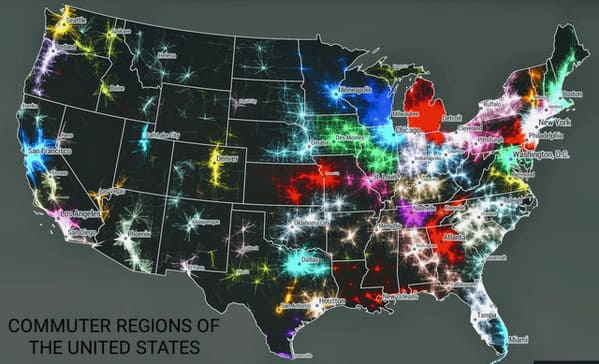
37. Commuters by region.
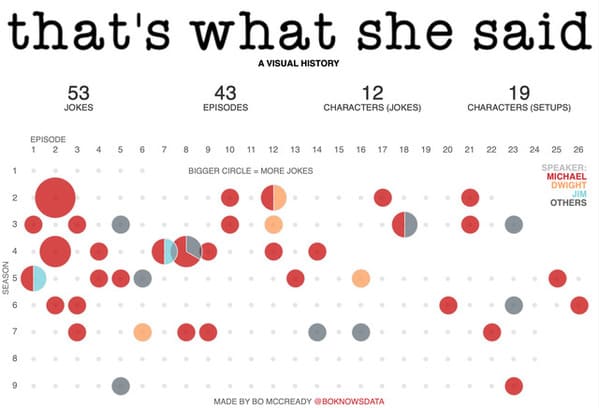
38. The Office “That’s what she said” chart.
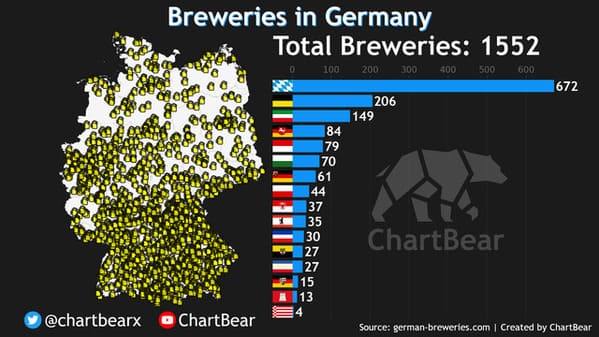
39. Breweries by the numbers.
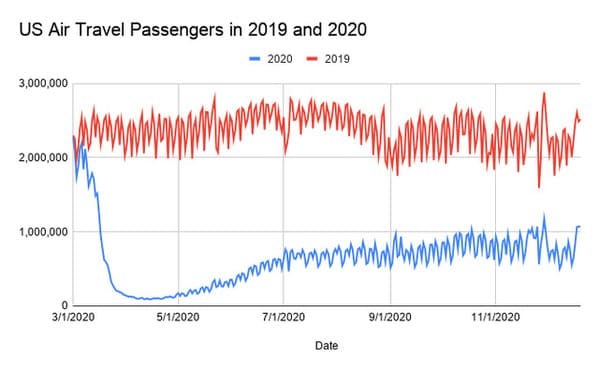
40. Traveling by plane during COVID.
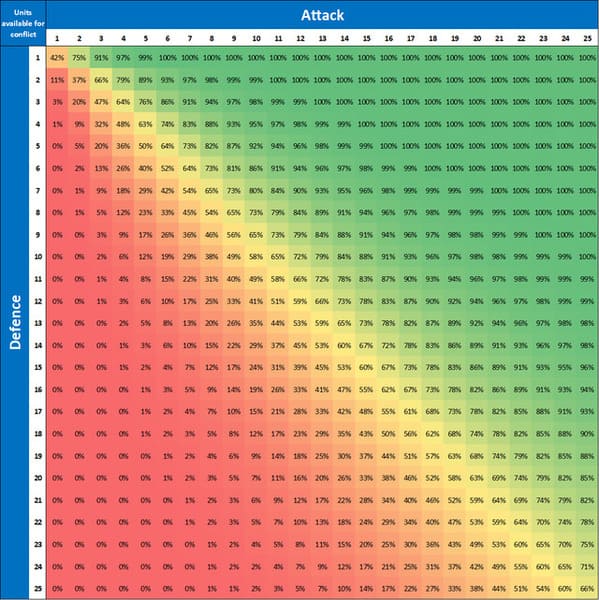
41. Risk probabilities.
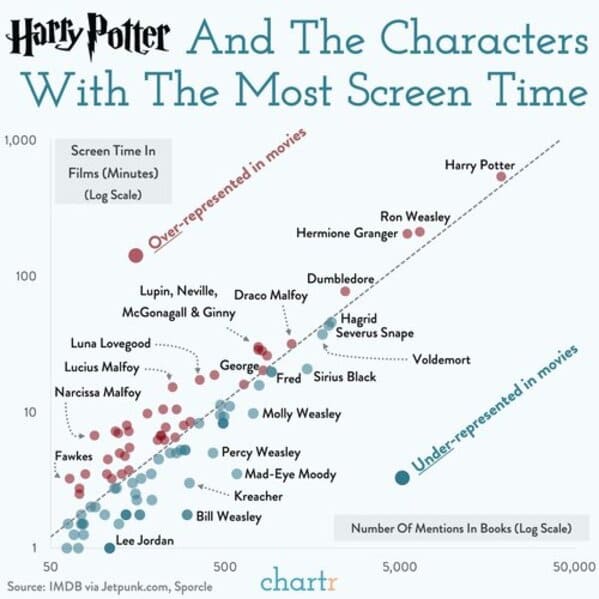
42. Hary Potter by screentime.
h/t Reddit: r/DataIsBeautiful

